Why It Matters
- Gain detailed statistics about user interactions with CometChat services.
- Measure user engagement using various parameters.
- Identify churn patterns and take corrective actions.
- Define and analyze conversational funnels using AI-powered insights.
- Classify and measure user personalities based on conversation styles.
- Optimize chat experiences and enhance user engagement through data-driven decision-making.
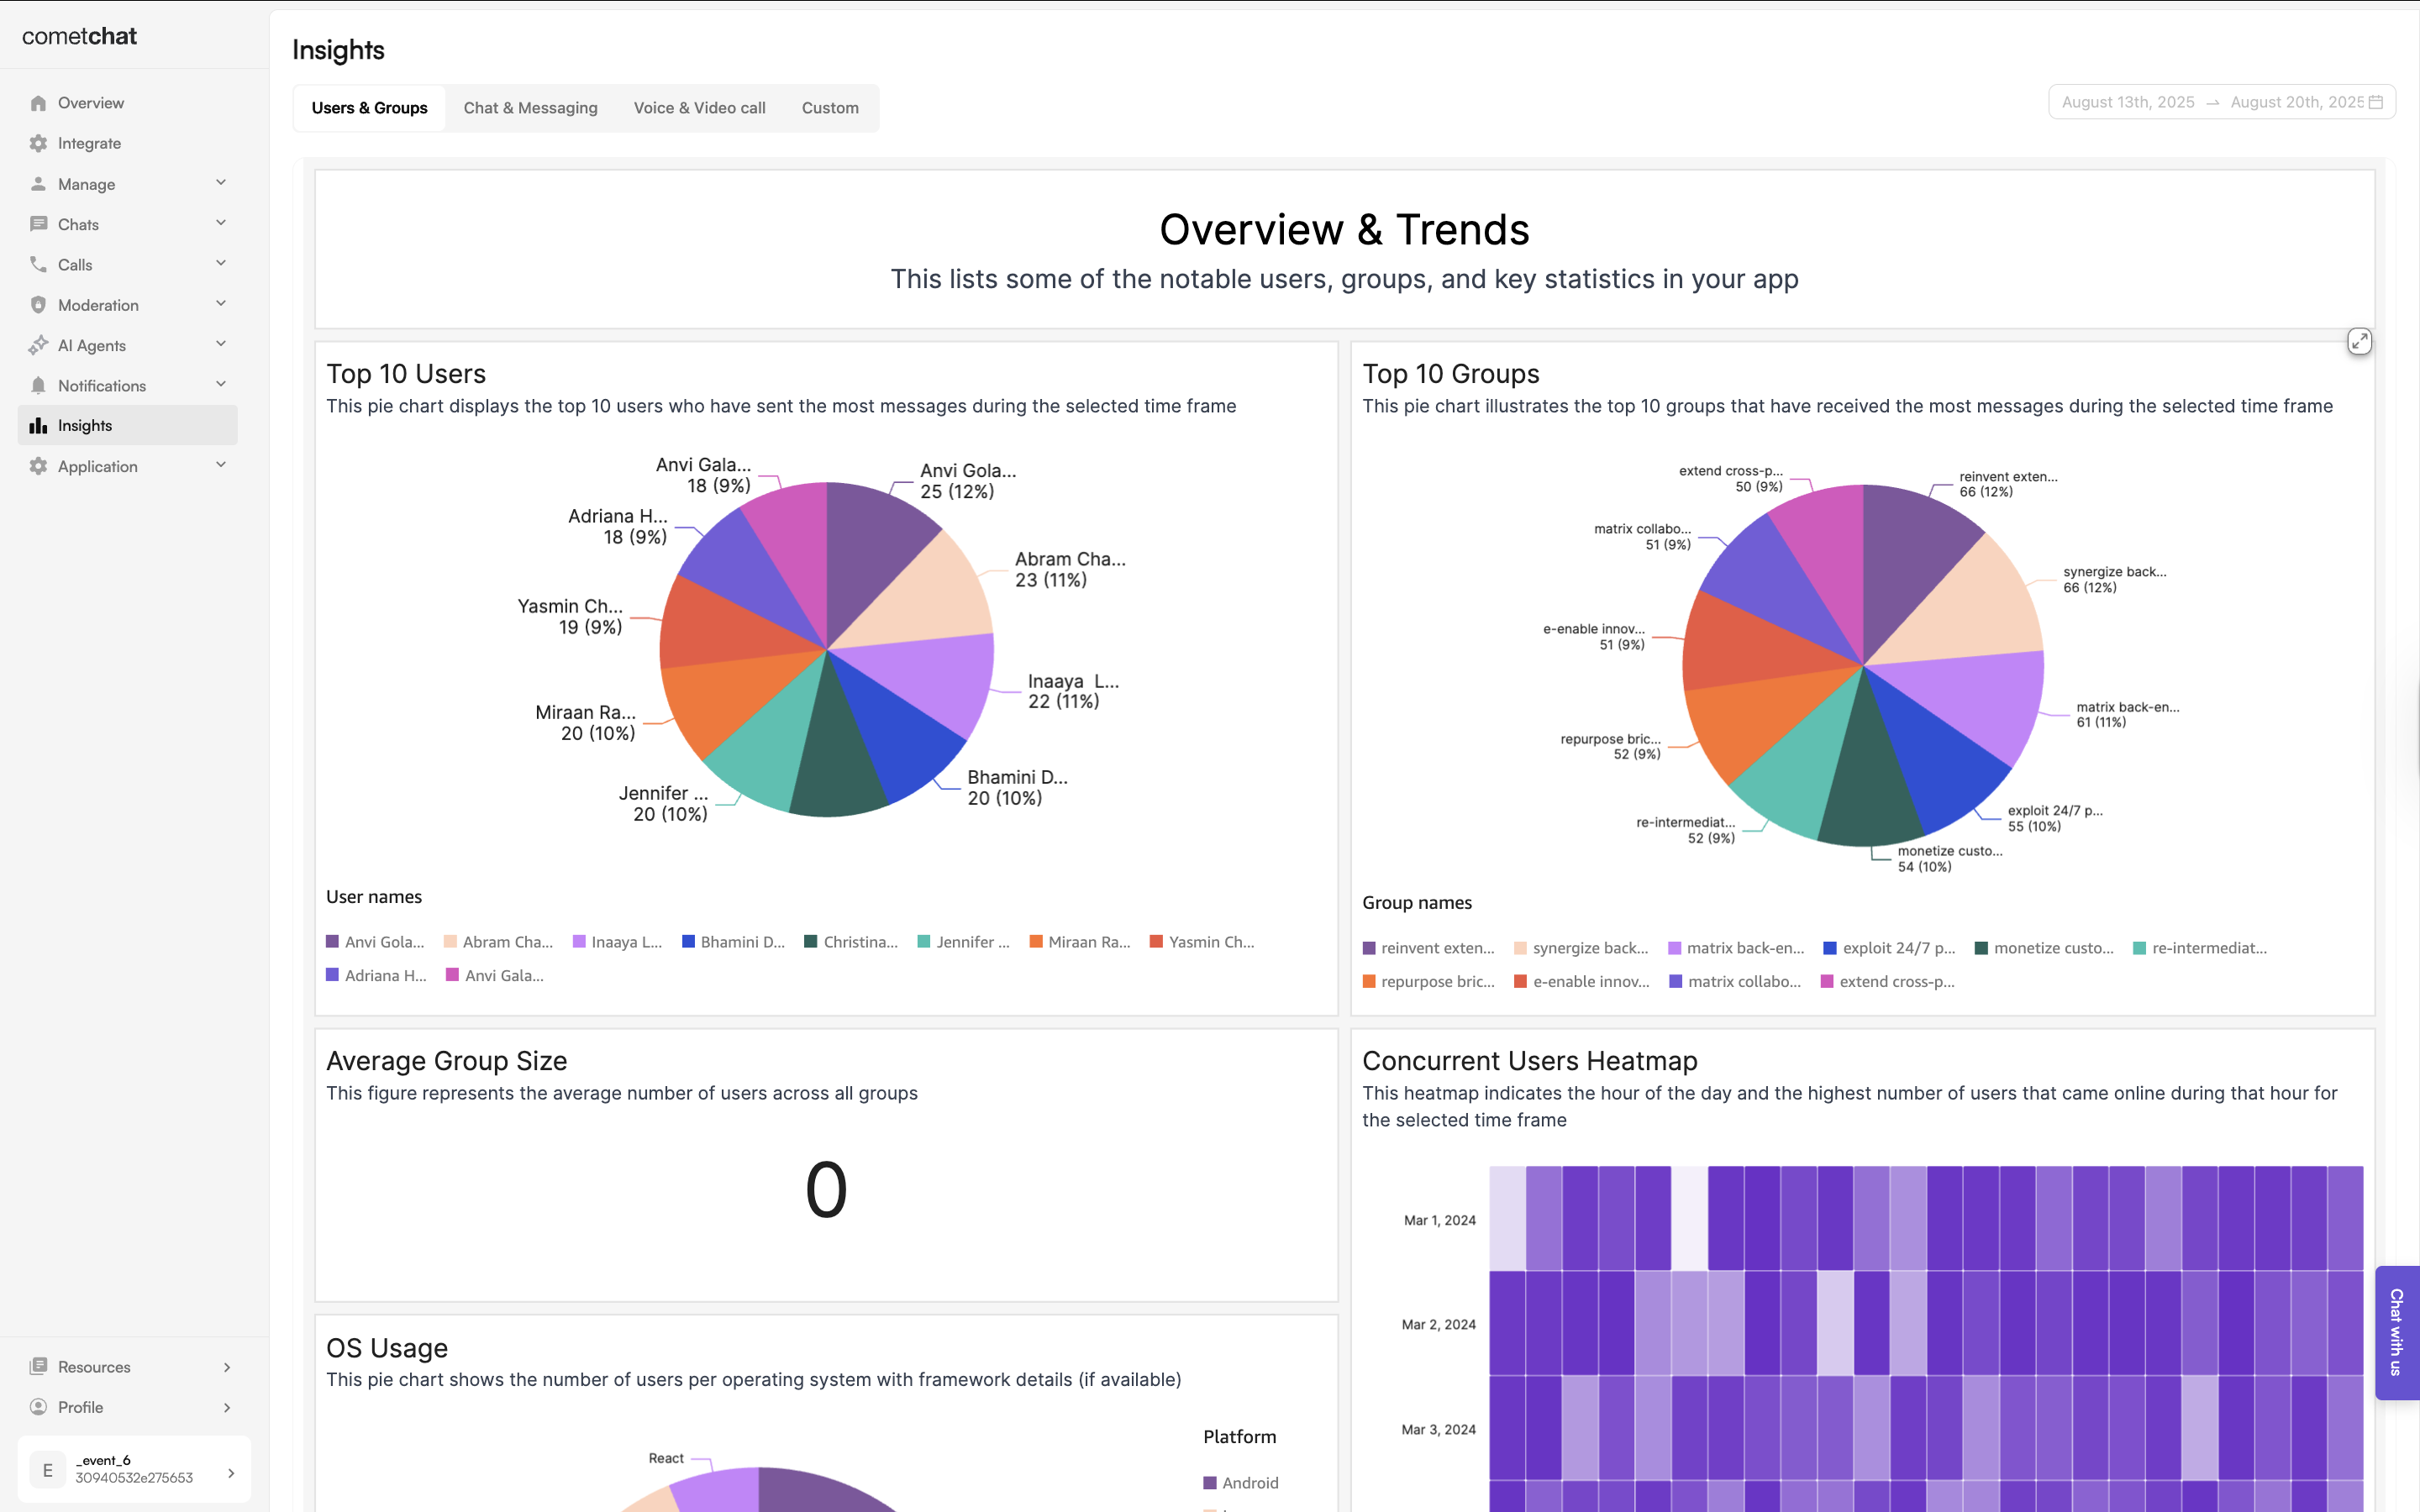
Users & Groups
High‑level engagement & population health.User Engagement Metrics
User Engagement Metrics
- Overview and trends: Displays user activity trends over time.
- Top 10 users: Identifies the most active users based on chat activity.
- Top 10 groups: Lists the most engaged chat groups.
- Average group size: Useful for social and community apps to determine group engagement levels.
- Concurrent users heatmap: Shows online activity per hour on a given day to determine user activity trends.
- OS usage: Indicates number of users per platform (iOS, Android, Web).
Growth & Engagement Metrics
Growth & Engagement Metrics
- New users created (daily/monthly): Tracks growth trends in user registrations.
- Time to first message: Measures user engagement speed post-signup.
- Users who reacted the most: Shows most active and influenced users from a Reaction perspective.
- Users who received the most Reactions: Shows most influential users.
- Online frequency distribution: Shows how often users come online in a day, indicating their engagement level.
- New friends Count: Tracks relationship-building activities in social or dating apps.
- Active group count: Measures group engagement over time.
- Online users per day: Shows daily active user trends.
Churn & Retention Analysis
Churn & Retention Analysis
- User retention analysis: Tracks number of users who have some activity in the last 30 days to assess churn trends.
- Cohort analysis of user abandonment: Identifies when users drop off and helps address engagement gaps and abandonment analysi.
- User abandon analysis funnel: Categorizes user churn based on activity type (e.g., never sent a message, sent messages but never made a call, etc.) for abandonment analysis.
- Group churn per day: Tracks the number of groups which don’t have any messages in the last 30 days to assess group churn trends.
Messaging Insights
Conversation flow quality & content dynamics.Overview & Trends
Overview & Trends
- Messaging activity: Tracks overall message sent, delivered and read numbers per day.
- Messages sent heatmap: Displays data to indicate hours when users perfer to send messages.
- Messages delivered heatmap: Displays data to indicate hours when users typically receive messages.
- Messages sent heatmap: Displays data to indicate hours when users perfer to read messages.
- Messages by conversation type: Breaks down messages into one-on-one and group conversations.
- Average messages across conversations: Measures engagement levels in terms of the number of messages sent in conversations.
- Message types sent : Identifies trends in text, images, video, and other media types.
- Thread messages: Shows the number of conversations that generated threaded discussions.
- Average word and character Count: Measures the verbosity of messages.
Growth & Engagement Metrics
Growth & Engagement Metrics
- New conversations per day: Indicates overall chat engagement growth.
- Active conversation distribution: Shows a distribution of the number of ongoing conversations accross users.
- Message engagement frequency: Tracks how often in terms of days do users send messages over time.
- User messaging behavior: Differentiates between active and passive users from their messaging behaviour.
- Number of messages before first image: Measures the transition from text to media engagement.
- Engagement progression by message type: Measures the transition from text to an alternative message type (excluding images).
- Average first response time: Measures response speed in a new conversations.
- Average response time per day: Measures response speed in a conversations per day.
- Chat to calls conversions: Measures the number of conversations which resulted in a call signifying an increase in engagement.
- Messages vs voice vs video: Measures the proportion of messages, voice calls, and video calls to measure the engagement patterns.
- Month over month active conversations: Compares the number of active conversations in a month compared to the previous one.
- Pre-call messaging: Measures the number of messages exchanged before a call.
- Number of mentions: Measures the number of mentions across conversations.
- Reactions count: Measures the number of reactions across conversations.
Retention & Churn Metrics
Retention & Churn Metrics
- Number of conversation churns: Measures the number of conversations without any new messages the last 30 days indicating an eminent churn.
- Messages before conversation churn: Measures the number of messages exchanged before conversation churns.
- Conversation churn time distribution: Measures the number of days after which conversations churn.
- Declining conversation count: Measures the number of conversations with a consistently declining message volume.
Voice & Video Calling Insights
Real‑time engagement patterns.Call Metrics
Call Metrics
- Call duration: Measures the total call duration across all calls for a given day.
- Call participation: Measures the average number of users in a call across all calls on a given day.
- Concurrent calls heatmap: Displays data to indicate hours when users perfer to make calls.
- Call duration distribution: Measures the call duration pattern across calls.
- Calls per day: Measures the total calls per day for a given day.
- Calling engagement frequency: Tracks how often in terms of days do users make calls.